

When we launched data.world, we knew that the most significant problem in our crosshairs was how to make the first mile of data work more manageable: finding, exploring, and contextualizing data, all while making it effortless to slice, dice, and join using the power of linked data. We’ve heard loud and clear from our community members that we’re making a big difference in how they approach their day to day work, so now it’s time to take that one step further.
Today, we’re going even deeper into the lifecycle of data work with the launch of Data Projects. Data Projects allow you to easily work with multiple datasets, and to publish insights and artifacts from your work in a way that encourages reproducibility. Think of this as the best way to track the lifecycle of your data work, and the easiest way to present it to others at any stage in the process. It’s the real-time record of your work, from question to conclusion.
There are already tens of thousands of open and private datasets on data.world. You may be wondering about the difference between a dataset and a Data Project. If you have a canonical data resource to share with your team or the community, such as this or this, start with a dataset. With a dataset, you can continue to to work on the data — documenting it, enhancing it, and adding to it.
If you’re ready to do analysis inside or outside of data.world, with your team, or on your own, start with a Data Project.
With the data.world platform, we have not set out to replace your existing data toolchain. Instead, the platform makes you more effective by being the connective tissue that keeps your data workflow efficient and your team up to date. Over the last few months, we’ve invested heavily in our APIs, including connectors to Python, R, Tableau, and an open source toolkit for anyone who wants to make a connector of their own. You can utilize these connectors to easily move data in and out of data.world, as well as push up derived data or analysis from your tool of choice.
Let’s take a tour of Data Projects!
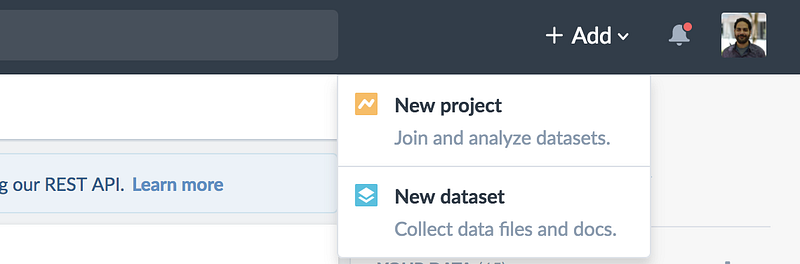
Getting started with Data Projects is easy! There’s always a button at the top of the page for easy access to start a new project. You can also create one via the “Add to Project” button on any dataset page.
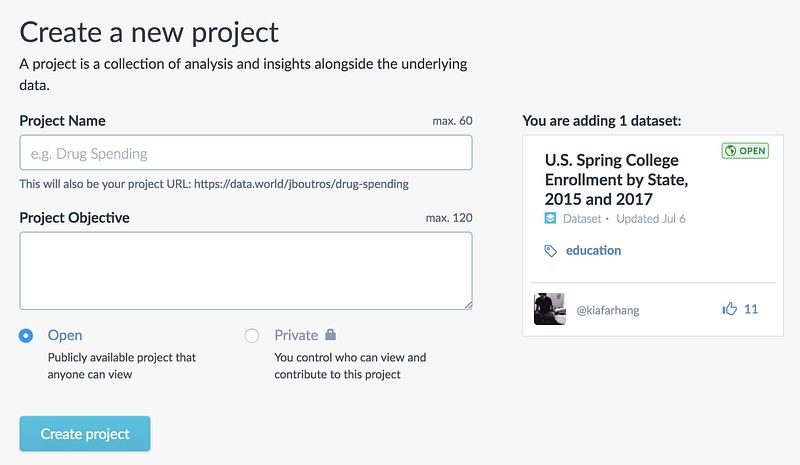
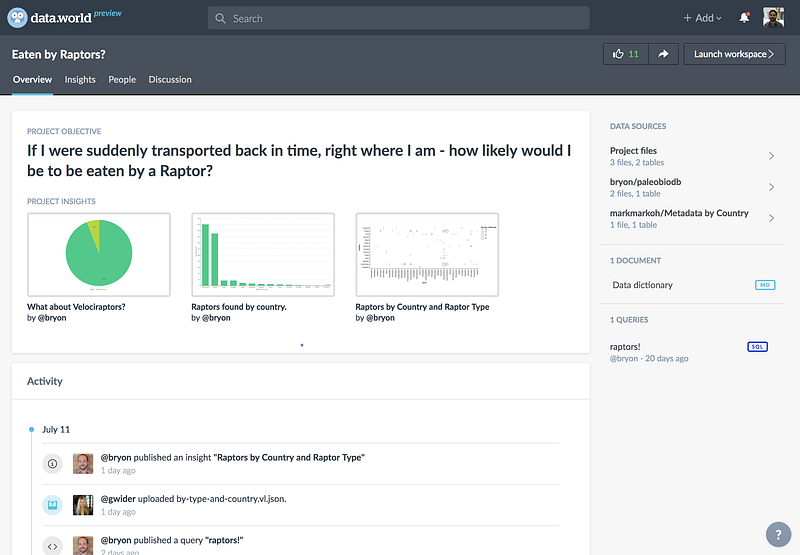
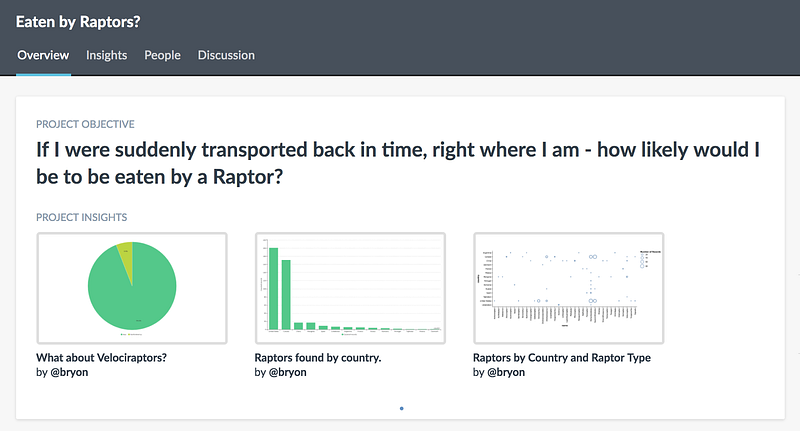
The project objective is a place to capture the main motivation of the project. It can be in the form of a question or area of exploration. This will feature prominently when others see your project around the site, so concise and descriptive is best!
Once the project is created, there are some key next steps:
1. add data
2. add people
3. add analysis
I’ll cover each of these below.
Linking data sources
Using multiple datasets in the same analysis is quite common. From enhancing your data with features from other datasets (like the American Community Survey), to using data from vastly different domains to solve unique problems (like the correlation between income and access to cancer clinical trials).
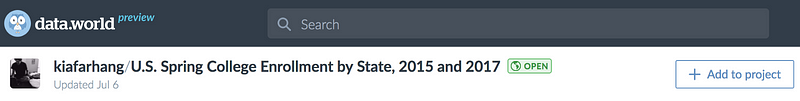
Here’s how linking works in data.world. Say you’ve found a dataset that you’re interested in working with, like this one, US College Enrollment by State. You can click “add to project”:
This will prompt you to link this dataset to either an existing project, or a new one. Once you’re done, the original dataset is now linked to the project by reference. The data hasn’t been copied, so all existing context, like discussions and the data dictionary, are still accessible.
From the project page, it’s easy to link additional datasets with the “Link a dataset” button:
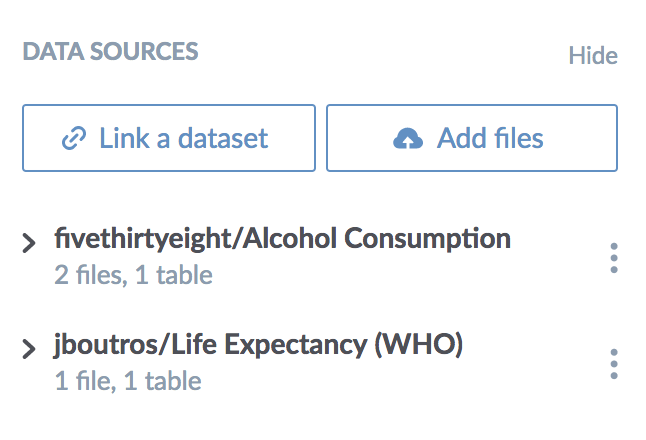
Linking multiple datasets keeps them handy and accessible to anyone who views your project. As you’ll see below, it also creates a contextual workspace to make it easy to investigate these datasets together. You can still upload data files to your project for one-off analysis, as well as scripts, visualizations, documentation, etc. Speaking of workspaces…
Collaborative Workspace
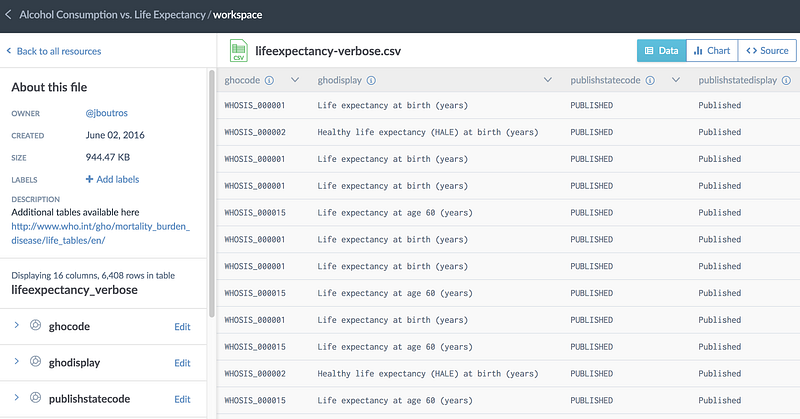
You may already be familiar with some of the data exploration tools in data.world. The file preview displays the raw data with the data dictionary right alongside it. The query tool allows you to query within and across datasets using SQL or SPARQL. The exploratory visualization tool allows you to intelligently plot multiple variables to get a visual sense of the data.
Workspaces bring all three of these tools into one interface. We heard your feedback that it could be tricky to switch back and forth between these tools, so that’s now easier than ever! From any project screen, clicking the “Launch Workspace” button will take you there.
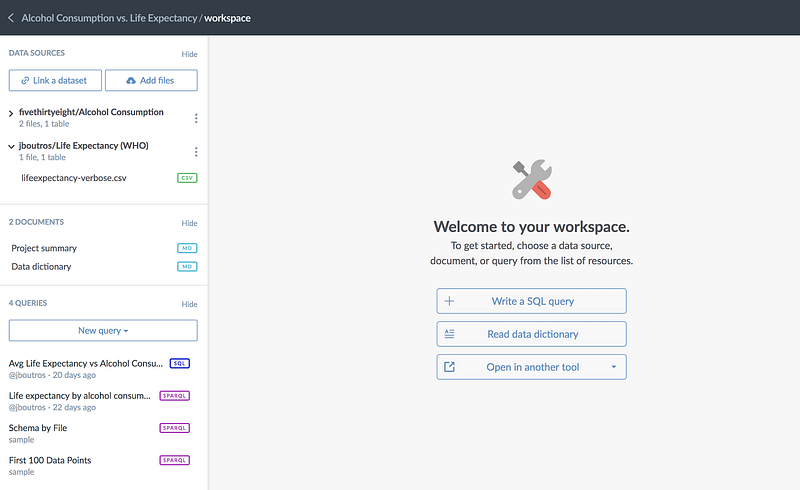
Here’s the main workspace screen. At the top left, your data sources are listed. These are all of the linked datasets (and any project files). Clicking on any data source will expand it, listing the files contained within. Selecting a file will load the file explorer with handy access to the data dictionary, visualization and query tools. “Back to all resources” will take you back to the main workspace sidebar at any time.
As you can see from the workspace sidebar, it’s easy to switch between files across all linked datasets, as well as any saved and published queries in the project.
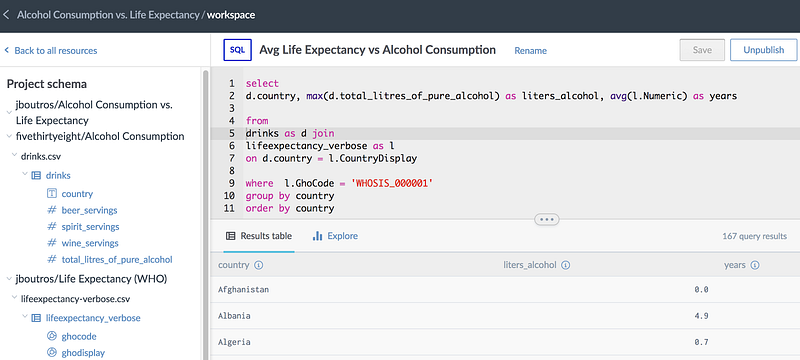
Workspaces have brought enhancements to the query tool as well. The query tool is aware of your project context, so file and table names from linked datasets can be accessed without their fully qualified name. In this example, I can use table names drinks and lifeexpectancy_verbose instead of fully qualifying them like jboutros.`life-expectancy-who`.lifeexpectancy_verbose. The query autocomplete is also project-aware, so you’ll get autocomplete suggestions from every dataset in the project.
We received so much positive early feedback about workspaces that we replaced the standalone versions of these tools inside datasets as well!
Reproducible Insights
Insights are a way to showcase the questions, answers, analysis, and everything in between while working on a data project. Insights show up at the top of your Data Project’s overview page, helping everyone get up to speed quickly.
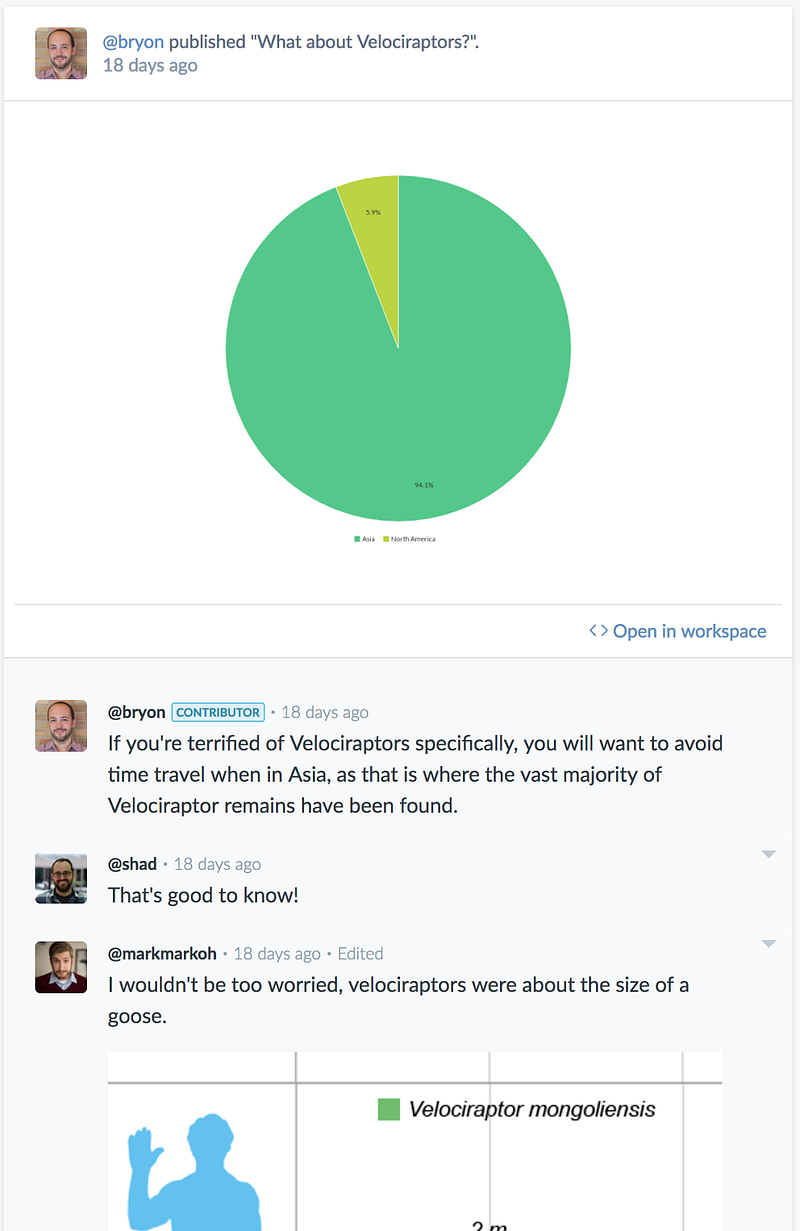
Clicking on any of these images will load the full insight, deep-linking you into a query, Markdown file, or (very soon) even a Python notebook. Insights have comment threads, allowing for discussion to live right next to the analysis that prompted it.
Insights are a great way to bubble up the key nuggets from analysis while staying just one click away from the work that generated it. They can be generated from any visualization from the workspace:
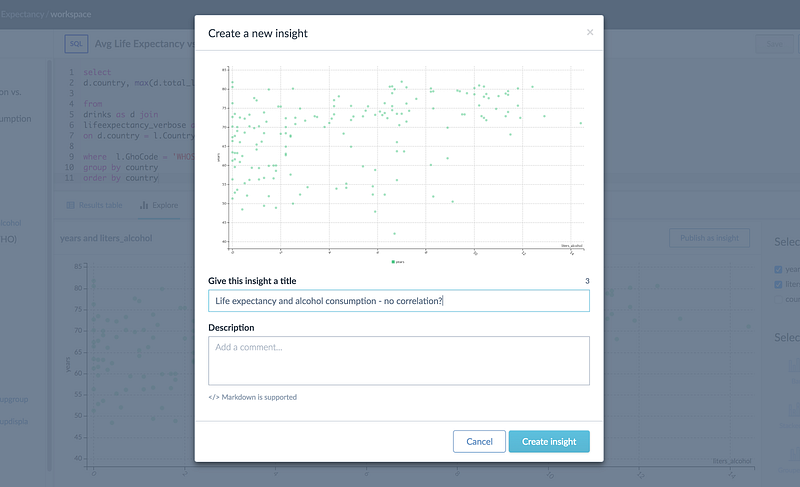
Insights can also be created from scratch, perhaps by uploading a visualization made using one of the data.world Python, R, or Tableau integrations.
Insights are under very active development, so expect to see a lot more coming!
Activity Feed
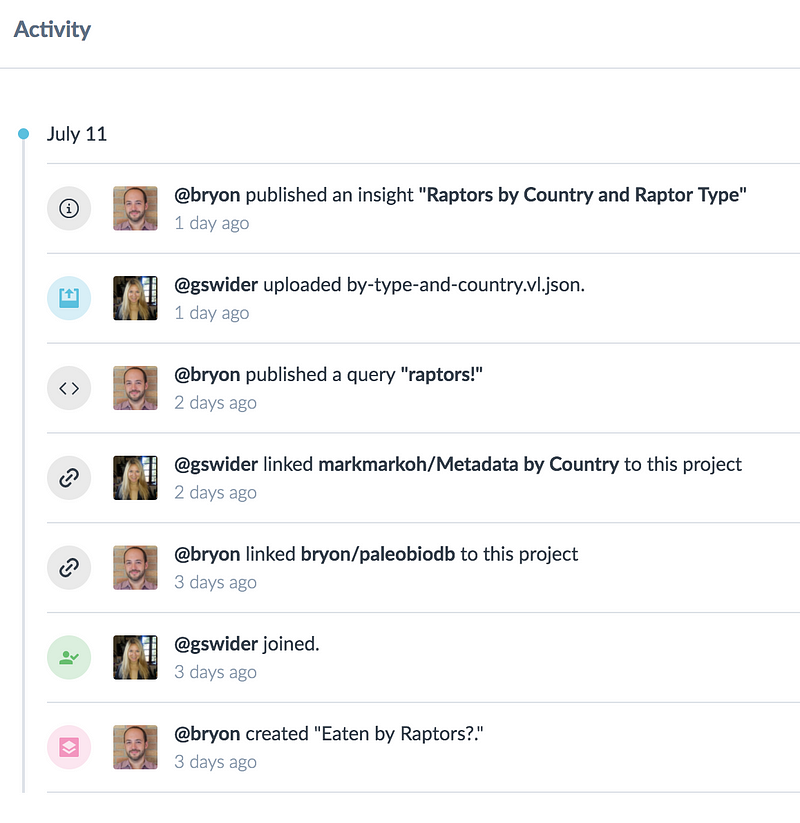
We’ve expanded the activity feed and put it front and center on the project overview page. This way, the entire lifecycle of the project is represented and it’s easy to understand who is responsible for what. Speaking of the “who,” Data Projects are a fantastic way to collaborate with your team. Simply invite them to join your project, whether they already have a data.world account or not.
We’d love to hear from you as you explore Data Projects! I invite you to join our new data.world community Slack group, or submit feedback or support requests directly through the app.
